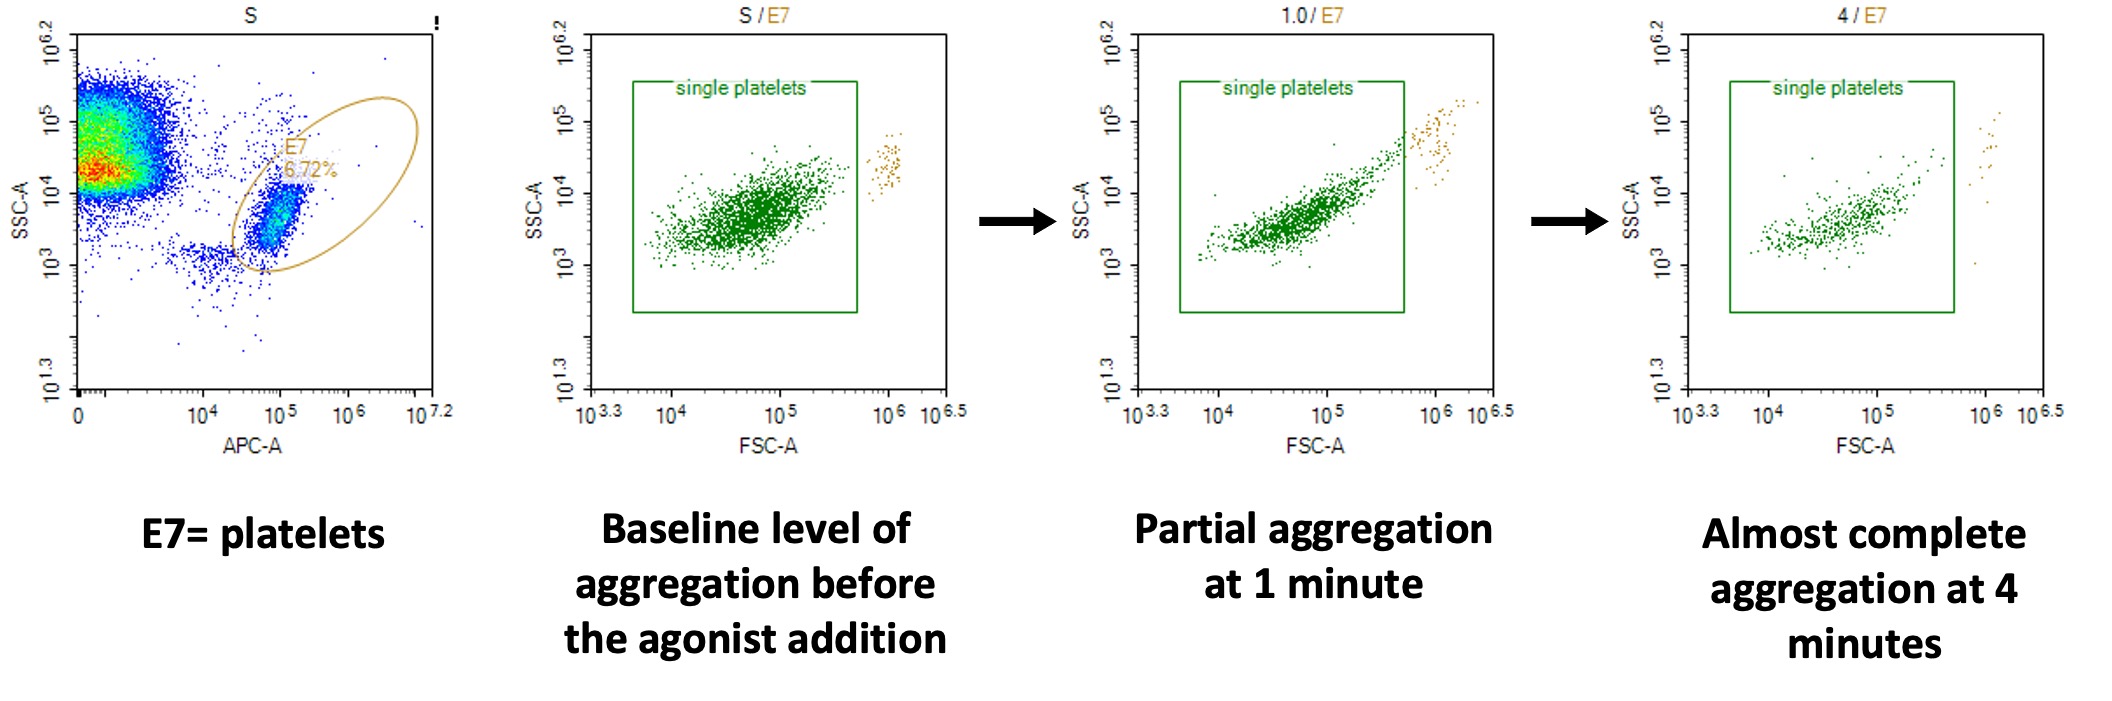
Single platelet counting by flow cytometry measures platelet aggregation in whole blood as a decrease in the number of single platelets over time after stimulation with an agonist and is particularly sensitive to platelet micro-aggregate formation. The advantage of this approach is that the samples can be stabilised using a dedicated fixative, which allows the analysis to be carried out at a later stage.
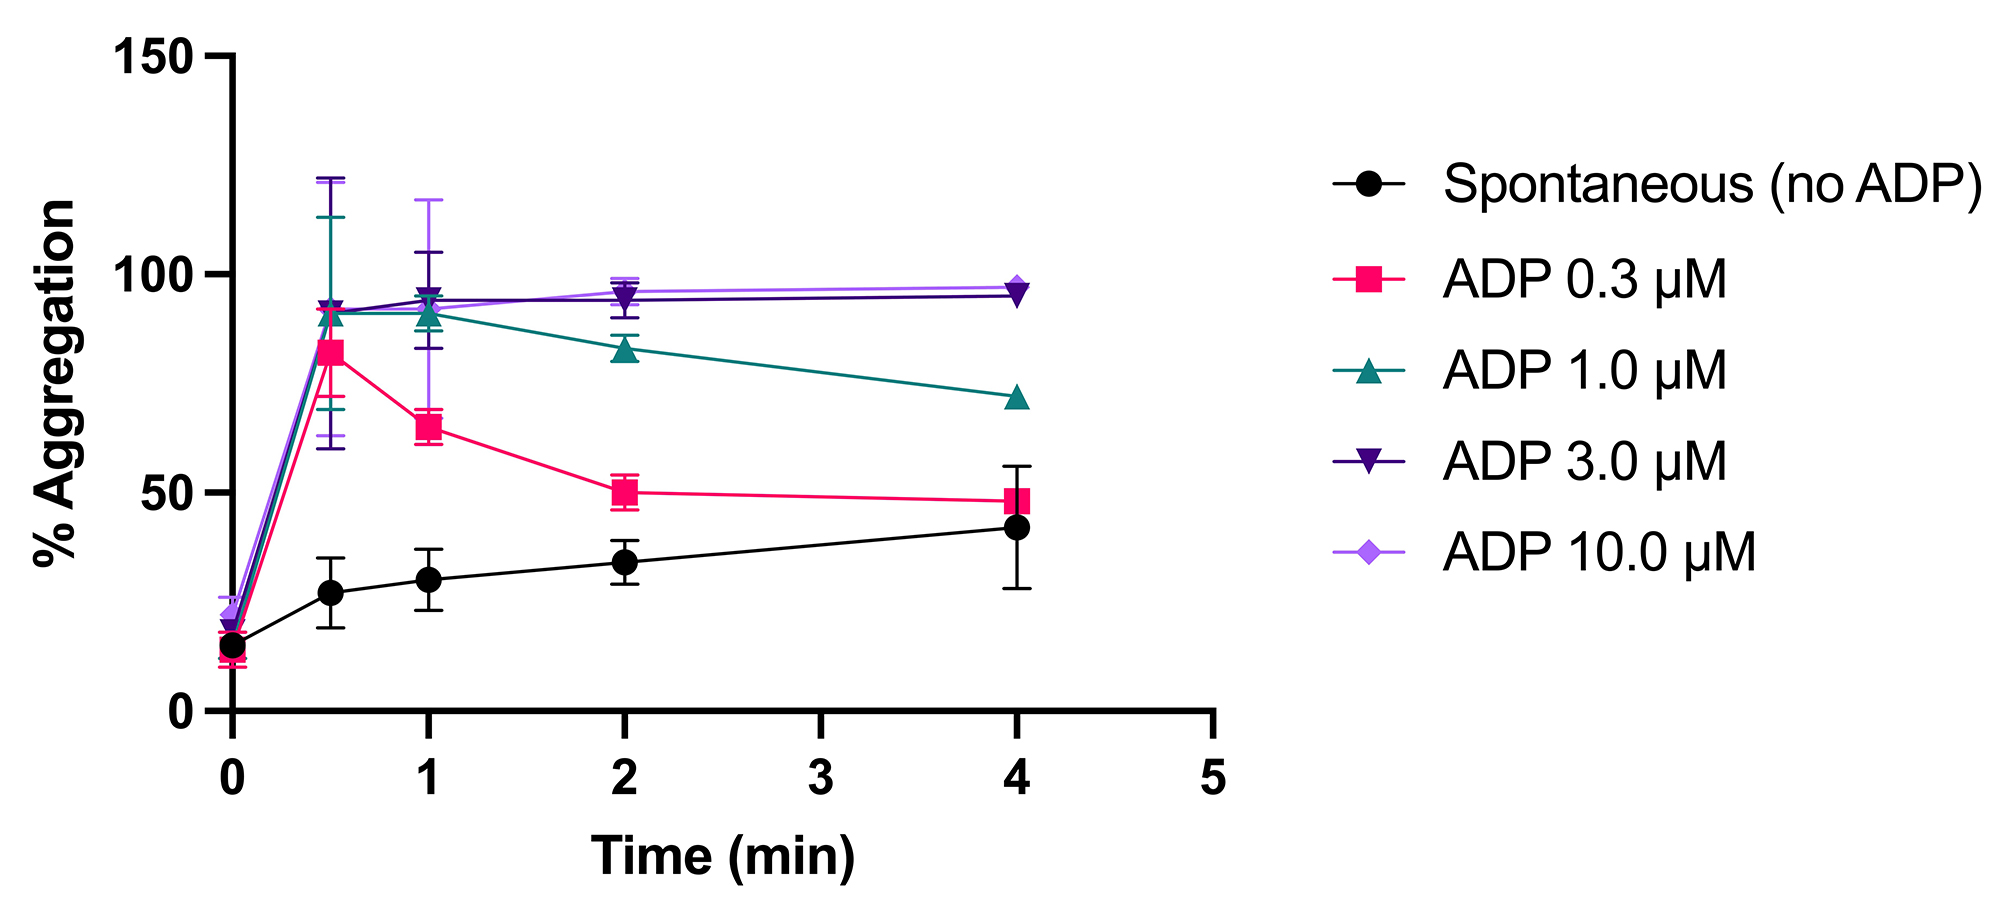
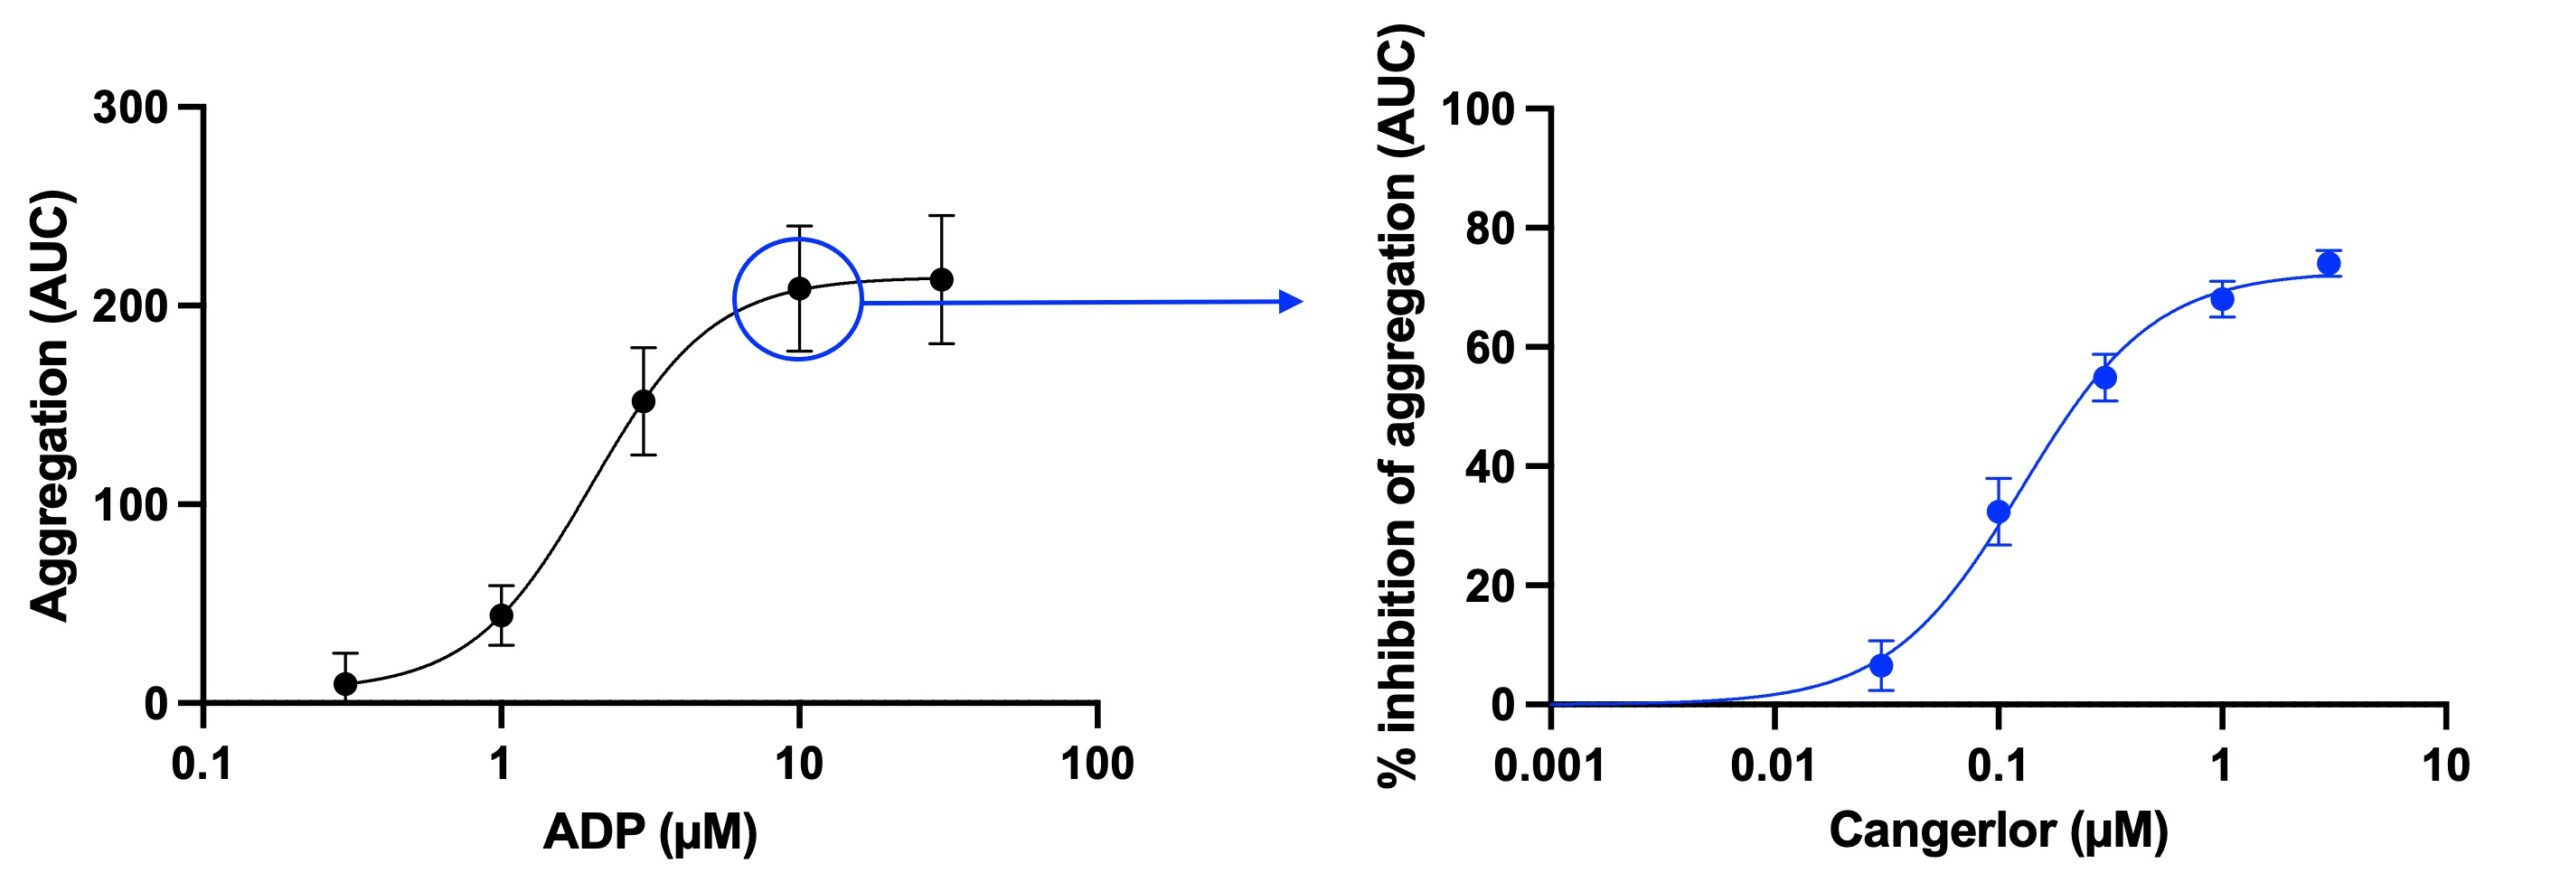
The samples can be fixed at several time-points providing data on dynamic aggregation response, similarly to LTA, with aggregation calculated and expressed as area under the curve (AUC). Alternatively, samples can be fixed at a single time-point offering a high throughput endpoint assay capable of generating numerous dose-response curves.
Use of whole blood provides the additional advantage of assessing platelet function in the presence of other blood cells. This can be particularly important for detecting potential indirect effects of agents on platelet function.
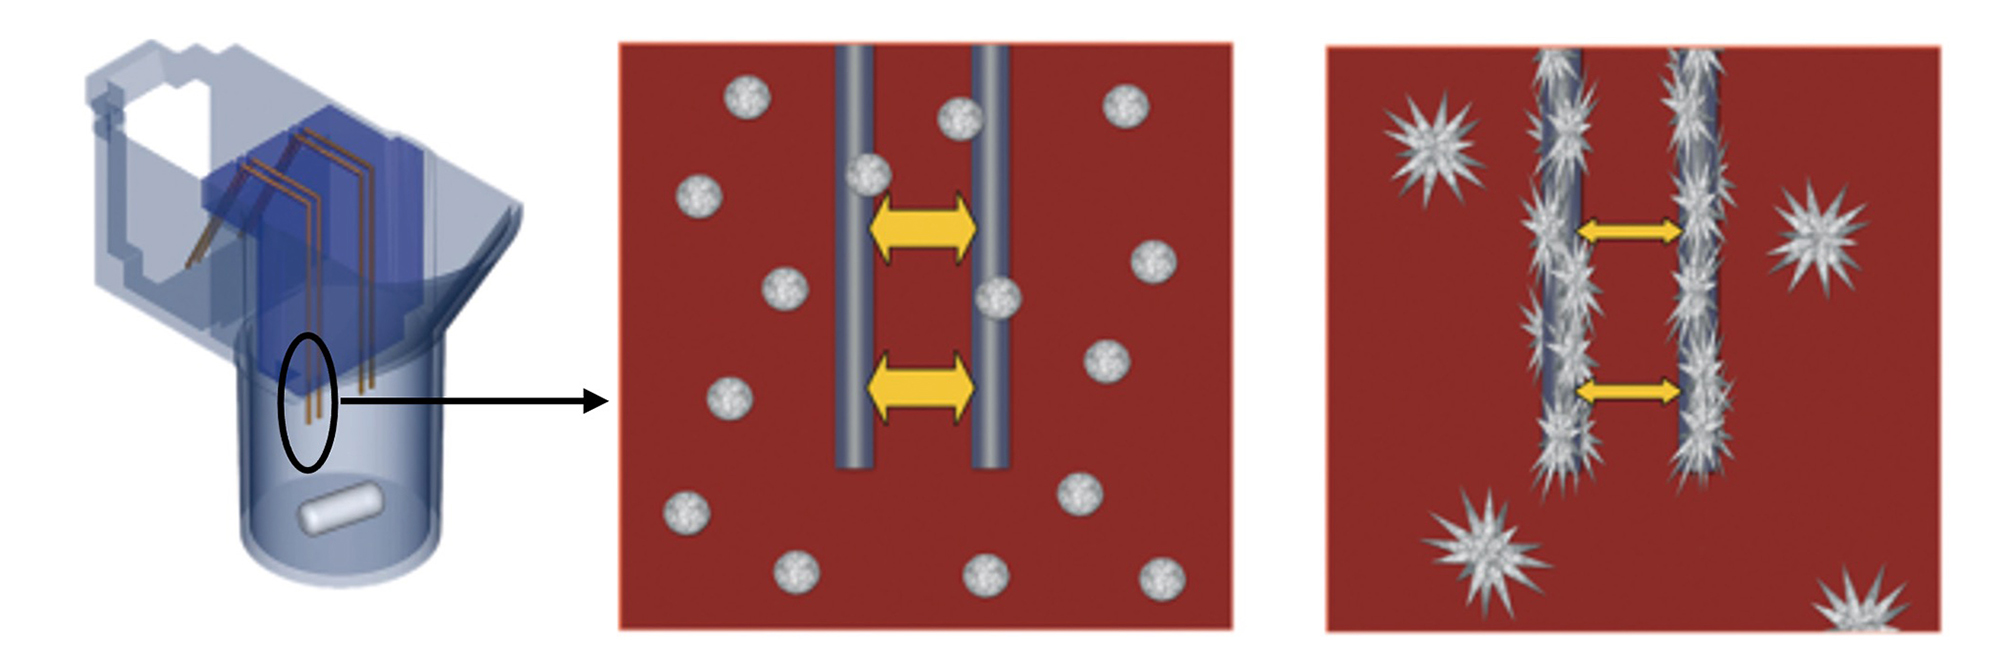
The principle is the same with both machines and is based on measuring the change in electrical impedance. Whole blood samples are placed into cuvettes and stirred with a magnetic stir bar. As platelets aggregate and accumulate on the electrodes in response to various platelet agonists, electrical resistance increases and this change in impedance is recorded over time.
Increase in electrical impedance between the
electrodes due to platelet aggregation
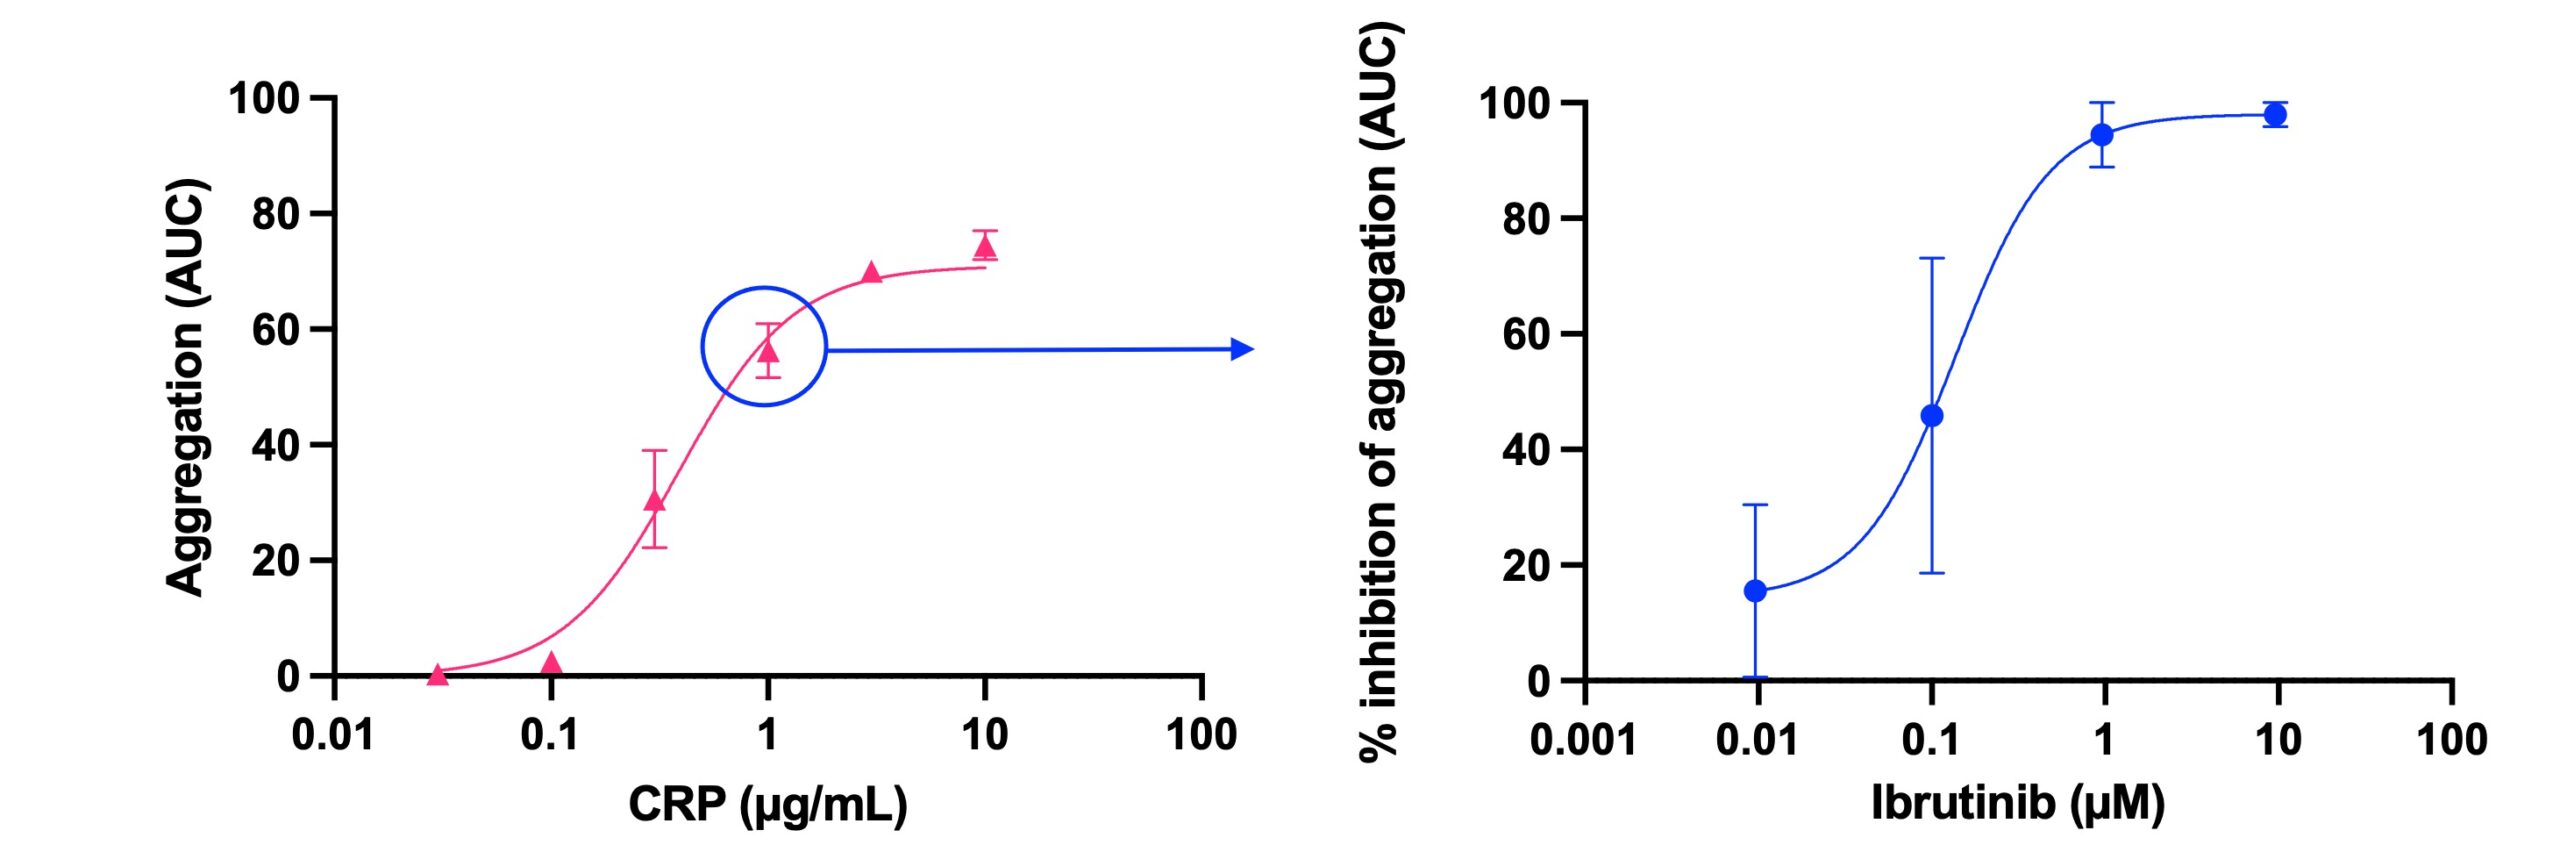
Aggregation response to a range of concentrations of collagen related peptide (CRP) measured in whole blood (WB) by impedance and presented as area under the aggregation curve (AUC) (left graph) and inhibition of CRP-induced aggregation (at 1.0 µg/mL) by ibrutinib, a tyrosine kinase inhibitor (dose response curve to ibrutinib, right graph).
Sign up to our monthly newsletter to stay up to date with the latest news from Platelet Services.
©2023 Platelet Services
Get in touch to find out how we can support you and your project.
| Cookie | Duration | Description |
|---|---|---|
| cookielawinfo-checkbox-analytics | 11 months | This cookie is set by GDPR Cookie Consent plugin. The cookie is used to store the user consent for the cookies in the category "Analytics". |
| cookielawinfo-checkbox-functional | 11 months | The cookie is set by GDPR cookie consent to record the user consent for the cookies in the category "Functional". |
| cookielawinfo-checkbox-necessary | 11 months | This cookie is set by GDPR Cookie Consent plugin. The cookies is used to store the user consent for the cookies in the category "Necessary". |
| cookielawinfo-checkbox-others | 11 months | This cookie is set by GDPR Cookie Consent plugin. The cookie is used to store the user consent for the cookies in the category "Other. |
| cookielawinfo-checkbox-performance | 11 months | This cookie is set by GDPR Cookie Consent plugin. The cookie is used to store the user consent for the cookies in the category "Performance". |
| viewed_cookie_policy | 11 months | The cookie is set by the GDPR Cookie Consent plugin and is used to store whether or not user has consented to the use of cookies. It does not store any personal data. |